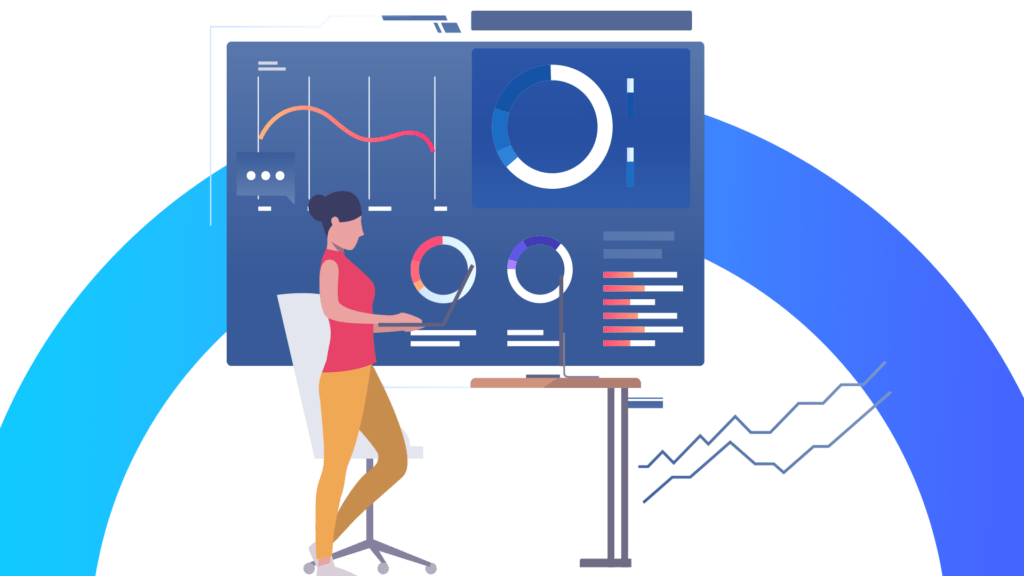
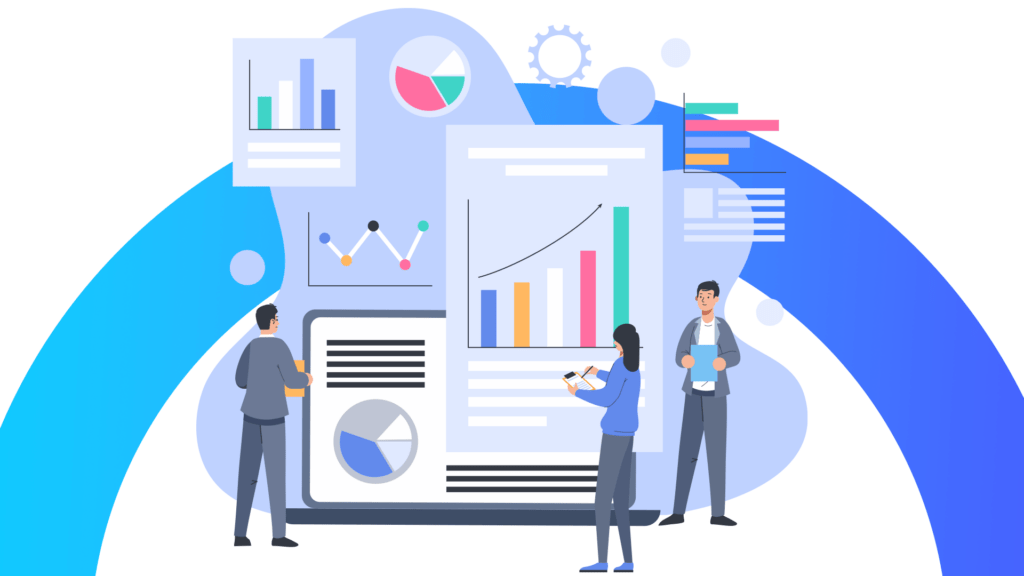
IoT visualization transforms raw data into actionable insights, helping industries make faster, smarter decisions. From real-time monitoring to simplifying complex data, it empowers teams to respond swiftly and optimize processes. Dive in to explore its benefits and techniques!
Introduction
Imagine being flooded with access to real-time data but having no straight path to make sense of it. This is a challenge numerous companies face, with the growth of the Internet of Things (IoT). Streams of data generated by IoT devices remain endless, but are without visualization – just numbers on a screen. IoT visualization changes the game. By creating clear and actionable visuals out of data, it’s helping teams make quick, confident decisions across industries.
Let’s explore how IoT visualization operates, it’s crucial role for modern businesses, and its impact across major industries.
What exactly is IoT visualization?
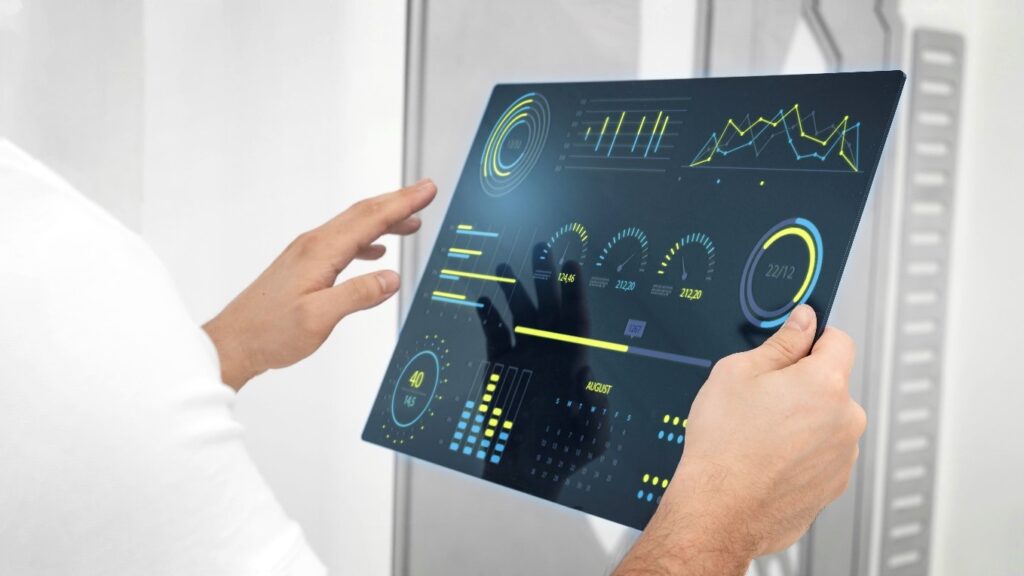
To put it simply, IoT visualization is the practice of turning raw IoT device data into visuals that are easy to interpret. Depending on the data type and insights required, these visuals may take various forms such as graphs, charts, dashboards or even 3D maps. Think of it as translating an obscure language into something you can read quickly. This makes an immense difference for businesses as they can quickly interpret data and act upon it instead of spending hours deciphering complex metrics.
How does IoT visualization work?
Here’s a quick breakdown of the process. First, IoT devices collect and send their collected data to a central system. This data can include anything from equipment status in a factory to heart rate data in healthcare. There it is cleaned and organized to make the data usable. The last step is for the visualization software to transform this data into an intuitive format that users can explore. These visuals are often interactive, offering filters, zoom features, or real time monitoring of trends.
Visualization enables teams to see what’s happening right now, recognize patterns, and focus in on specifics. With IoT visualization, they don’t just get data—they get insights as well.
The key benefits of IoT visualization
1. Better decision-making
IoT visualization converts raw data into visuals that people can readily understand and act upon. This includes monitoring machinery performance through IoT visualization to catch any minor issues before they escalate into costly issues. This way, visualization supports faster, more informed decisions.
2. Real-time monitoring
For industries like healthcare or energy, that require instant oversight, IoT visualization is invaluable. Real-time visualization allows teams to spot irregularities as they happen. Alerts and notifications add another layer of safety, letting teams address issues immediately when data readings go beyond set thresholds.
3. Efficiency boost
IoT visualization offers businesses insight that helps them optimize their processes. In manufacturing, visualized data may reveal inefficient production lines quickly allowing managers to make quick adjustments. The result? Better resource management, reduced waste, and improved output.
4. Simplifying data for everyone
IoT data can be incredibly complex, and without visualization, it’s often only accessible to technical experts. With IoT visualization tools in place, all stakeholders from executives to floor managers can make data-driven decisions together.
Visualization techniques: making the most of IoT data
Different types of visuals highlight different insights, and IoT visualization often combines several styles. Here are a few popular ones:
- Line charts: Great for tracking trends, like temperature changes or machine usage over time.
- Heat maps: Ideal for highlighting geographic data, like network coverage strength across regions.
- Scatter plots: Useful for spotting relationships in data, like comparing equipment usage with maintenance frequency.
- Bar graphs: Effective for comparing categories, such as tracking monthly sales across different product lines.
Each method serves a purpose, and IoT visualization tools typically offer multiple ways to view data for a well-rounded understanding.
IoT visualization across industries
IoT visualization has applications across almost every industry imaginable, from healthcare to agriculture. Here’s how certain sectors use it to produce tangible results:
Manufacturing
Visualization offers manufacturers an invaluable way to monitor equipment performance, throughput, minimizing downtime and increasing quality of production quality.
Healthcare
Visualization technology used by IoT systems enables quick tracking of patient metrics in medical settings, for quicker intervention and improved care.
Agriculture
Farmers use visualization to monitor environmental factors, like optimizing crop yields, soil moisture, and water usage.
Smart cities
Urban planners leverage IoT visualization for monitoring traffic flow, energy use and air quality to make cities more livable.
Every industry uses IoT visualization differently, but the goal is the same: clearer data, better decisions.
Real-time visualization: a competitive edge
It lets businesses see IoT data as it updates, empowering teams to respond instantly to changes. Furthermore, it can be especially valuable in industries like energy and logistics where timing is of the utmost importance.
OEEfficienci does just that, providing real-time IoT visualization, converting live operational data into clear, actionable visuals. By gathering, processing, and presenting KPIs through an intuitive dashboard, it helps teams monitor equipment status and address inefficiencies quickly. With real-time notifications and an easy-to-navigate interface, OEEfficienci empowers users to make swift, data-backed decisions, driving optimal efficiency across operations.
Tackling challenges in IoT visualization
The future of IoT visualization
Final thoughts
IoT visualization is more than just a tool; it’s a window into data’s full potential. By turning raw information into easily understood visuals, it enables businesses to act upon insights and make positive changes more quickly and efficiently. From manufacturing, healthcare and agriculture sectors alike – IoT visualization helps make faster decisions with efficiency. As IoT tech advances, visualization will become an even more valuable asset in the digital landscape, turning data into a key driver of growth and innovation.
To become a part of future, enable your business with IoT visualization through OmniConnectTM and book a demo.

